Blog Archive

Wednesday, November 24, 2021

Quantile-on-Quantile Regression Using Eviews

Introduction

Nonlinearity is everywhere. To model it, analysts have conjectured in their wildest imagination all manners of techniques. Quantile-on-quantile is one of the latest in the research community. If you haven't seen it applied like most other techniques, it's because it requires a lot of heavy lifting in terms of coding. I have brought you this to ease the burden of using one of the most widely used platforms -- Eviews.

Conventionally, quantile regression traces out the effects of the conditional distribution of dependent variable on the dependent variable itself through the impact of the independent variable. It is like asking what the impact of interest rate will be like on inflation if inflation has already reached a particular threshold. Of course, such a question cannot be addressed straightforwardly within the received OLS knowledge. This is where quantile regression stands in to fill the gap.

But then, what about the new estimation strategy quantile-on-quantile regression? Here, both the conditional distributions of the dependent and independent variables modulate the impact of the latter on the former. So, in this case, the question we are interested in is, for example, how extreme inflation (e.g., inflation at say 95 percentile) will respond to extreme interest rate (e.g., at 30-40 percent higher than usual). Put simply, we are interested in how different levels of the independent variable will alter the distribution of the dependent variable. This question cannot be addressed using quantile regression. Because of the existence of two extreme scenarios surfacing within the same policy strategy, the quantile-on-quantile regression comes to the rescue.

QQR is proposed by Sim and Zhou (2015). Yes, it is such a recent method. Again, we are not interested so much in the theory behind this. This can be found in their paper, and I hope the summary here will help you understand that aspect of their paper.
 

Summary of the method

Let the relationship between \(x_t\) and \(y_t\) be given by
\[y_t=\beta^\theta (x_t)+\epsilon_t^\theta\]
Now let \(\tau\)-quantile of \(x_t\) be \(x_t^\tau\). Sim and Zhou suggest the relationship above be approximated by first order Taylor expansion of \(\beta^\theta (x_t)\) around \(x_t^\tau\)
\[\beta^\theta (x_t)\approx \beta_1 (\tau,\theta) + \beta_2 (\tau,\theta)(x_t-x_t^\tau).\]
If follows that
\[y_t= \beta_1 (\tau,\theta) + \beta_2 (\tau,\theta)(x_t-x_t^\tau)+\epsilon_t^\theta\]
At a given value of \(\tau\), the preceding equation can be estimated by quantile regression. Basically, we estimate\[\hat{\beta} (\tau,\theta)=\underset{\beta (\tau,\theta)}{\text{argmin}}\sum_{t=1}^T\rho_\theta \left(y_t - \beta_1 (\tau,\theta)-\beta_2 (\tau,\theta)(x_t-x_t^\tau)\right)\]
where \(\rho_\theta(\cdot)\) is the check function. Rather than estimating this model, the authors realize that there is a need to weight the function appropriately. The reason is that the interest is in the effect exerted locally by the \(\tau\)-quantile of \(x_t\) on \(y_t\). This makes sense in that otherwise the effect will not be contained in the neighbourhood of \(\tau\). They choose the normal kernel function to smooth out unwanted effects that could contaminate the results. The weights so generated are inversely related to the distance between \(x_t\) and \(x_t^\tau\) or, equivalently, between the empirical distribution of \(x_t\), \(F(x_t)\), and \(\tau\). I follow suit in developing the code. Now, the model becomes
\[\hat{\beta} (\tau,\theta)=\underset{\beta (\tau,\theta)}{\text{argmin}}\sum_{t=1}^T\rho_\theta \left(y_t - \beta_1 (\tau,\theta) - \beta_2 (\tau,\theta)(x_t-x_t^\tau)\right)K\left(\frac{(x_t-x_t^\tau)}{h}\right)\]
where \(h\) is the bandwidth. As the choice of bandwidth is critical to getting a good result, in this application, I choose the Silverman optimal bandwidth given by
\[h=\alpha\sigma N^{-1/3}\]
where \(\sigma=\text{min}(IQR/1.34, \text{std}(x))\), \(IQR\) is the inter-quantile range, \(N\) is the sample size and \(\alpha=3.49\).

One snag, however, needs to be pointed out. Eviews does not feature surface plot normally used to present the results in this case. To me, this turns to be an advantage because a more revealing graphical technique has been devised for that purpose. It aligns the boxplots to summarize the results in an equally excellent, if not better, way.

In what follows, I will lead you gently into the world of QQR addin in Eviews

Eviews example

Addin Environment

The QQR addin environment is depicted in Figure 1. If you've already installed the addin, you can click on the Add-ins tab to display the QQR dialogue box as seen below.

Figure 1

The dialogue box is self-explanatory. Three edit boxes are featured. The first one asks you to input the dependent variable followed by a list of exogenous variables. You can include both C and @trend among the exogeneous variables here. However, you should not include the quantile exogeneous variable, which you are required to enter in the second edit box. Note that only one quantile exogeneous variable can be entered here. In the third edit box the period of estimation is indicated.

Example is given in Figure 2. Here, we are estimating the quantile-on-quantile effects of oil price (OILPR) on exchange rate (EXR). We include the third variable, interest rate (INTR). This estimation is carried out over the period of May 2004 and January 2020. Although oil price is an exogenous variable, by entering it in the second variable, we make it the variable whose quantile effect we want to study. 


Figure 2

A couple of options are provided. The Coefficient plots category wants you to choose whether to produce the graphs for all the variables in the model or to just produce the graph for the quantile exogenous variable alone. The default is to generate the graphs for all the coefficients in the model. The Graph category wants you to choose to rotate or not the plots. Orientation may count at times. The default is to rotate the plots. Lastly, there is the Plot Label category. How do you want your graphs labelled? On one side or on both sides. It may not matter much. But beauty they say is in the eyes of beholder. I think I love the double-sided label. Hence the default. These categories are boxed with color code in Figure 3.

Figure 3

Graphical Outputs

As noted above, Eviews has yet to develop either the contour or the surface plot usually favored for the quantile-on-quantile result presentations. In the absence of these valuable tools, I opt for boxplot. Boxplot presents the distribution of the data with a couple of details (median, mean, whiskers, outliers and in Eviews confidence interval). But it is a 2-D plot. This means one can only view one side of the object on the x-y plane. To view the other side of the object, one needs to rotate the object. In other words, one needs two 2-D plots to capture some details of the 3-D objects. That is why we have the two plots for one parameter! The graph is named quantileonquantileplot##. The shade indicates 95% confidence interval. 

In Figures 4-6, I present the graphs for the three coefficients. 


Figure 4
 

Figure 5


Figure 6

The same results are presented in Figures 7-9 but this time not rotated!
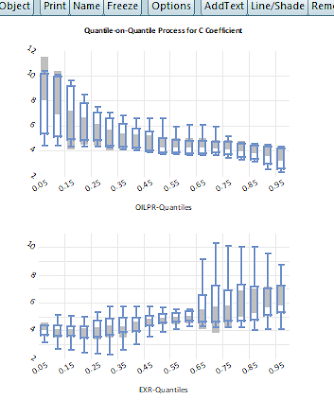

Figure 7


Figure 8

Figure 9

External resources

If one really wants to report the contour or surface plot, there is still hope. Eviews has provided an opportunity to interact with external computational software like MATLAB and R. Since I have MATLAB installed on my system, I simply run the following code in Figure 10. The inputs to the snippet include the matrix and vector objects generated and quietly dumped by the QQR addin in the workfile. They are a19\(\times\)k  coefmatrix and a 19-vector taus respectively, where k is the number of parameters estimated.  


Figure 10

Figures 11-13 compare the graphs of the estimated coefficients from the QQR addin with those generated using MATLAB. Therefore, you can still estimate your quantile-on-quantile using the Eviews addin as discussed here and have the surface plots for the estimated coefficients done in MATLAB or R. What is more? R is a open source and free.


Figure 11


Figure 12


Figure 13

Requirement

This addin runs fine on Eviews 12. It hasn't been done yet on lower versions. 

How to get the addin...
Wondering how to have this addin, are you? Follow this blog!😏 The link is here to download the addin.

Thank you for tagging along.


Sunday, November 14, 2021

Multiple-Threshold Nonlinear ARDL (MT-NARDL)

Introduction

The Multiple Threshold Nonlinear ARDL method can be found in Verheyen (2013) as an extension of the ARDL to the nonlinearity ARDL (NARDL) model. Basically, the NARDL model decomposes the series into two around zero, implying NARDL is focused on the median value of the series as the threshold point. Rather than being focused on one threshold point (whether around the median or at the median value), the Multiple Threshold Nonlinear ARDL model is focused on more than one threshold point. The graph below gives an idea of what MTARDL does. Each vertical line is a threshold point in the distribution of the series. Arbitrary partioning can be done but is not justifiable. It is better to focus on certain partioning that is sensible. Partioning into quantiles is more appealing and that is what is done in this post.

                                                Fig1: Partioning of the series into sections


Let x be the series of interest to be portioned into subunits. Let the Q(τ|Δx) be the τ quantile of Δx. The portion of x below the quantile is given by

\[x_t ^{Q(\tau_b|\Delta x)}=\sum_{j=1}^t\{\Delta x_j<Q(\tau_b|\Delta x)\}\Delta x_j\]

Above a given quantile, the generated series is given by

\[x_t ^{Q(\tau_a|\Delta x)}=\sum_{j=1}^t\{\Delta x_j>Q(\tau_a|\Delta x)\}\Delta x_j\]

For the regime that lies in between, the generated series is given by

\[x_t ^{Q_{a|b}(\tau|\Delta x)}=\sum_{j=1}^t\{Q(\tau_a|\Delta x)<\Delta x_j<Q(\tau_b|\Delta x)\}\Delta x_j\]

Long-run Relationship

Suppose we are interested in the relationship between y and x. Specifically, suppose we want to study the quantile-based effect of x on y. The long-run relationship of interest is then given by

\[y_t =\alpha +\beta x_t^{Q(t_a)}+\chi x_t^{Q(t_b)}+\gamma x_t^{Q(t_{a|b})}+\epsilon_t\]

Adopting an ARDL framework for the model, we have an ARDL(k,l,m,n) as specified:

\[y_t =\lambda +\sum_{j=1}^k \varphi_j y_{t-j}+\sum_{j=0}^l \phi_j x_{t-j}^{Q(t_a)}+\sum_{j=0}^m \psi_j x_{t-j}^{Q(t_b)}+\sum_{j=0}^n \eta_j  x_{t-j}^{Q(t_{a|b})}+\epsilon_t\] 

A reparameterized version of the above model is given by:

\[\begin{multline*}\Delta y_t =\theta_0 + \theta_1 y_{t-1}+ \theta_2 x_{t-1}^{Q(t_a)}+ \theta_3 x_{t-1}^{Q(t_b)}+ \theta_4 x_{t-1}^{Q(t_{a|b})} +\cdots \\\sum_{j=1}^{k-1} \delta_{1,j} \Delta y_{t-j}+\sum_{j=0}^{l-1}  \delta_{2,j} \Delta  x_{t-j}^{Q(t_a)}+\sum_{j=0}^{m-1} \delta_{3,j} \Delta x_{t-j}^{Q(t_b)}+\sum_{j=0}^{n-1} \delta_{4,j} \Delta   x_{t-j}^{Q(t_{a|b})}+\mu_t\end{multline*}\] 

The FPSS seeks to test the hypothesis that

\[\theta_1 = \theta_2 = \theta_3 = \theta_4 =0\]

Rule out the degenerate cases by t-ratio tests of each of the level variables in the model. An inbuilt Eviews code needed most for the implementation of Multiple Threshold Nonlinear ARDL is:

                                                Q(τ|x)=@quantile(x,τ)

Although the model makes use of the quantile concept to deal with the problem at hand, this is not what has been termed Quantile ARDL (QARDL) in the literature. We will discuss the idea subsequently. But note that whereas the MTARDL uses the quantile on the regressors, the QARDL applies the same on the dependent variable.

Steps in implementing MTARDL in Eviews

  1. Decide on the threshold variable to be decomposed (say x)
  2. Compute the difference of the variable (i.e., Δx)
  3. Compute the thresholds using the formula

                                series Q1 = @quantile(Δx,τ1)

                                series Q2 = @quantile(Δx,τ2)

            Note that the quantile is computed from Δx and NOT x

        4. Given the computed threshold value for Δx above, generate

            - series for the lower-tail regime:

                              series x_lw=@cumsum((Δx<Q1)*Δx)

            - series for the upper-tail regime:

                              series x_up=@cumsum((Δx>Q2)*Δx)

            - series for the inner-corridor regime:

                             series x_in=@cumsum(((Δx>Q1) and (Δx<Q2))*Δx)

            There can be more than one inner-corridor regime if there are more than two threshold points.                For example, if there is a third threshold Q3, the two inner-corridor regimes will be given by

                            series x_in1=@cumsum(((Δx>Q1) and (Δx<Q2))*Δx)

                            series x_in2=@cumsum(((Δx>Q2) and (Δx<Q3))*Δx)

      5. After computing the series for all the regimes, the model in (5) can then be estimated within the              ARDL equation environment. To do that, type

                                            y x_lw x_up x_in

         for two-threshold/three-regime model, and

                                            y x_lw x_up x_in1 x_in2

         for three-threshold/four-regime model

All the analyses that can be performed within Eviews environment for ARDL can also be carried out for MTARDL.


Eviews Implementation

Suppose we have three variables and we are seeking the LR relationship between stock price exchange rate and oil price. We'll illustrate the steps as follows:

STEP I: We decide on oil price

We are interested in the multiple threshold effect of oil price on stock market activity. We, therefore, need to find the thresholds (at 25% and 75%) for oil price.

STEPS II and III: Difference and thresholds

The screenshot below shows how we achieve this. We click on the genr button in the workfile and the Generate Series by Equation dialog box shows up. We input the expression for the first threshold, which is

                                oilthre25=@quantile(d(oilpr),0.25)

for 25 percentile and OK box. We do the same for the 75 percentile typing

                                oilthre75=@quantile(d(oilpr),0.75)

instead.


Note that we have implicitly computed the difference for oilpr in the expressions above. In other words, the first two steps are already taken care of.

STEP IV: Generate the series for the regimes

To generate series for three regimes, we need the difference and the thresholds as inputs. We achieve this through the Generate Series by Equation dialog box by typing the following:

For Regime One:


oilreg1=@cumsum((d(oilpr)<oilthre25)*d(oilpr))


For Regime Two:

oilreg2=@cumsum(((d(oilpr)>oilthre25) and (d(oilpr)<oilthre75))*d(oilpr))


For Regime Three:

oilreg3=@cumsum((d(oilpr)>oilp75)*d(oilpr))


We have the three regimes plotted in the figure below.


STEP V: Multiple Threshold ARDL

We are now in a position to do MTARDL. Go to Quick and select Estimate Equation…. From the Equation Estimation dialog box, change the method to ARDL – Auto-regressive Distributed Lag Models in the Estimation settings group. Having done that, input your variables as shown in the screenshot below:


The result is as shown below, yielding MTARDL(1,3,1,0,1) model


The ECM representation of the model is given below. Though no long-run exists for this example, the process of going about MTARDL is as demonstrated.


Other functionalities that come with Eviews for ARDL can be used.

Saturday, November 13, 2021

Estimating Threshold Adjustment Cointegration Models with Eviews (Part I)

Introduction

Cointegration techniques are a popular approach to detect the long-run relationship among economic variables. One of the classical approaches to investigating the long-run relation is the well-known Engle-Granger method, which assumes a symmetric adjustment to equilibrium. This adjustment implies that the Engle-Granger approach treats adjustment to equilibrium as invariant to the magnitude of the extent and the position of disequilibrium taking place. In other words, whether or not the error correction term is above the equilibrium level, the Engle-Granger approach treats both cases as having similar adjustment process. However, this approach does not permit the asymmetric adjustment of the system towards equilibrium. As experience has shown and demonstrated by a number of researchers, most economic relationships are asymmetric.

To this end, Enders and Siklos (2001) propose a threshold adjustment by extending the Engle-Granger approach to accommodate the asymmetric adjustment to equilibrium (read about it here).The asymmetric error correction can be couched in terms of the already familiar approaches, namely, the Enders-Granger (1998) threshold autoregressive (TAR) and the momentum-TAR (M-TAR) test methods for unit-root. The approach is a generalization of the Tong (1983) method where the degree of autoregressive decay depends on the state of the variable of interest, whereas the M-TAR approach impinges the autoregressive decay on the changes in the variable of interest.

In this post, I discuss and implement the steps that can be used to carry out this cointegration test in Eviews. In particular, I am going to make use of the well-developed suite of threshold estimation method in Eviews. Along the line, I will illustrate the threshold autoregressive (TAR) and Momentum TAR (M-TAR) model.

The Model

Suppose we wish to study the long-run relationship between \(y_t\) and \(x_t\) using the following model:
\[y_t=\alpha+\beta x_t +\epsilon_t\]
Suppose further that the variables are at levels indicating that we are interested in the long-run relation. One way to establish this is to use the well-known Engle-Granger cointegration approach. We’ll have to examine the stationarity of the residuals, \(\hat{\epsilon}_t\), obtained from the regression of \(y_t\) on \(x_t\) (the Engle-Granger approach). This can be done using the standard ADF test. 
\[\Delta\hat{\epsilon}_t=\rho\hat{\epsilon}_{t-1}+\sum^p_{j=1}\theta_j \Delta\hat{\epsilon}_{t-j} +\mu_t\]

Figure 1

If the two series are cointegrated, the residuals should be stationary at levels, that is, the residuals must be I(0). This finding will then indicate the two series are cointegrated. Eviews has an inbuilt procedure for implementing that. Now, suppose, for example, that the two series in question are inflation and interest rate plotted in Figure 1. The Engle-Granger test procedure can be achieved by issuing the command line code or by opening the series to be investigated as a group and then selecting Cointegration Test from View. Clicking on Single-Equation Cointegration Test pops up the default dialog for Engle-Granger cointegration test. Figure 2 reports the EG test result for inflation and interest. The output shows two cases. The first treats interest rate as the dependent variable while the second treats inflation as the dependent variable. Cointegration is established for the two relationships, looking at the p-values.

Figure 2

The following code snippet achieves the same result:

%group="engle_granger"
group {%group} inr infl
freeze(mode=overwrite, eg_result) {%group}.coint(method=eg)
show eg_result

It should be run from the program environment as a prg.

Enders and Siklos Meet Engle and Granger

However, we may suspect that the data generating process (DGP) for the residuals follows TAR or M-TAR process. Enders and Siklos (2001) outline how to study these models. Rather than suspecting if this is the case, we empirically investigate to find out if the data in any way indicate the need to use TAR model. In Figure 3, we estimate the kernel densities for the distributions of the inflation and interest rate when the error correction term is above or below the zero. There is no inherent reason for choosing zero anyway! In the subsequent analysis, we will endogenously determine the threshold value.

Figure 3

Obviously, the figure shows that the kernel densities are different across the regimes depending on whether the error correction term is negative or positive. It follows that modelling the asymmetric adjustment will have a substantial implication for the results. To give more content to our suspicion, we plot the scatterplot for inflation and interest rate in Figure 4. The regression line for positive adjustment is steeper than the regression line for negative adjustment. This plot shows that it is appropriate to fit a TAR model for this relationship.

Figure 4: Implication for long-run relationship

We now turn to the specification and estimation of the TAR model. The process takes the following form:
\[\Delta \hat{\epsilon}_{t}=\rho_1 Q_t \hat{\epsilon}_{t-1} +\rho_1 (1-Q_t) \hat{\epsilon}_{t-1}+\mu_t\]
where \(Q_t=\{I_t, M_t\}\) is
 the Heaviside function given by
\[I_t=\begin{cases} 1, & \text{if}\; \hat{\epsilon}_{t-1}\geqslant\tau\\ 0, & \text{if}\; \hat{\epsilon}_{t-1}\lt\tau \end{cases},\]
for the threshold autoregressive (TAR) model and by
\[M_t=\begin{cases} 1, & \text{if}\; \Delta\hat{\epsilon}_{t-1}\geqslant\tau\\ 0, & \text{if}\; \Delta\hat{\epsilon}_{t-1}\lt\tau \end{cases},\]
for the Momentum Threshold Autoregressive (M-TAR) model. To illustrate we will work with the series on inflation and interest rate used in the plots above.

Steps involved

I'll continue with the example of the relationship between inflation and interest rate. 
STEP 1: Estimate the long-run model and obtain the residuals 
\[infl_t=\alpha+\beta int_t+\epsilon_t\]

Figure 5: Residuals

The residuals are reported in Figure 5. One may not be able to have visual impression of adjustment asymmetry. That is, we are concerned about how fast the system returns to equilibrium following a shock to the system. A speed of adjustment relates the change in the error to the first lag of the error. It is the ratio of the change in residuals to the first lag of the residuals that constitutes the speed and is denoted as (\(\rho\)) in the model being analyzed here. 

Bear in mind that we are not particularly interested in residuals being symmetric or not, but in its adjustment asymmetry. We are interested in the implications of the variations of the residuals (in the positive and negative regimes) for the speed of adjustment. It is in this speed of adjustment that our interest lies. We exploratorily plot the implied regime-based speeds for the relationship. From the plot, we observe that the negative regime depicts steeper slope and so adjustment is much speedier in that regime than in the positive regime. Thus, the exploratory exercise reveals that the adjustment may not likely be symmetric. So let's proceed anyway to figure out more rigorously the asymmetric effect😁.


Figure 6: Speed of adjustment plot

STEP 2: Define the Heaviside function for the TAR model. 
\[I_t=\begin{cases} 1, & \text{if}\; \hat{\epsilon}_{t-1}\geqslant\tau\\ 0, & \text{if}\; \hat{\epsilon}_{t-1}\lt\tau \end{cases}\]
for the TAR model or 
\[M_t=\begin{cases} 1, & \text{if}\; \Delta\hat{\epsilon}_{t-1}\geqslant\tau\\ 0, & \text{if}\; \Delta\hat{\epsilon}_{t-1}\lt\tau \end{cases}\]
for the M-TAR model.
STEP 3: Estimate the following model:
\[\Delta \hat{\epsilon}_{t}=\rho_1 Q_t \hat{\epsilon}_{t-1} +\rho_2 (1-Q_t) \hat{\epsilon}_{t-1}+\mu_t\]
STEP 4: Check for serial correlation and ARCH effect
  • if serial correlation is present, then estimate the following model instead:
\[\Delta \hat{\epsilon}_{t}=\rho_1 I_t \hat{\epsilon}_{t-1} +\rho_2 (1-I_t) \hat{\epsilon}_{t-1}+\sum_{j=1}^{\hat{p}}\theta_j \Delta \hat{\epsilon}_{t-j} +\xi_t\]
where \(\hat{p}=\underset{p\in P}{\text{argmin}} IC(p)\)
  is the optimal lag length obtained through the information criteria
  • if no serial correlation is present, then the model in STEP 3 should be accepted:
\[\Delta \hat{\epsilon}_{t}=\rho_1 Q_t \hat{\epsilon}_{t-1} +\rho_2 (1-Q_t) \hat{\epsilon}_{t-1}+\xi_t\]
where \(Q_t=\{I_t,M_t\}\).
STEP 5: Carry out the cointegration tests: t-Max and  \(\Phi\)-statistic (for \(\tau=0\) ) or t-Max* and \(\Phi^*\)-statistic (if \(\tau\) is unknown). 
\(\Phi^*\): F-statistic of \(\rho_1=\rho_2=0\)
  \(t-\text{Max}^*: \text{max}(t_1,t_2)\) between \(\rho_1=0\) and \(\rho_2=0\)

The critical values for these statistics can be found in Enders and Siklos's original paper.  

STEP 6: Carry out the symmetric adjustment test
            \(H_0: \rho_1=\rho_2\)
STEP 7: The asymmetric adjustment error-correction model is then estimated
\[\Delta infl_t=\alpha+\kappa_1 Q_t \hat{\epsilon}_{t-1}+\kappa_2 (1-Q_t) \hat{\epsilon}_{t-1}+\psi(L)\Delta infl_{t-1}+\phi(L)\Delta int_{t-1}+\eta_t\]
where \(Q_t=\{M_t, Q_t\} \). 

Eviews Implementation

Having presented the steps one needs to follow to estimate the TAR or M-TAR model, I now state how implementations can be done using Eviews. I will discuss two approaches. The first, rather inappropriate for a serious research, is the Click approach. The second approach is to batch the steps involved. If you are itching to jump to into using the code, here you have it.

Click-and-drop approach (OLS-based)

There are two ways the click-and-drop can be used. One is through the LS method. Consider Figure 7. This is OLS estimation method. To estimate the residuals needed according to Step 1, I list infl lner c in the editbox. I estimate the model (results in Figure 8) and make the residuals, which I name as epsilon. The residuals are as reported in Figure 5. 

Figure 7

Figure 8

Figure 9 shows how the combination of Steps 2 and 3 can be executed.

Figure 9

Let me explain how. 
You'll notice that I still use the LS method. Using the residuals obtained previously, I specify the following by list approach:

d(epsilon) epsilon(-1)*(epsilon(-1)<0) epsilon(-1)*(epsilon(-1)>=0)

Both (epsilon(-1)<0) and (epsilon(-1)>=0) in this expression are indicators as given by the indicator function:
\[I_t=\begin{cases} 1, & \text{if}\; \hat{\epsilon}_{t-1}\geqslant\tau\\ 0, & \text{if}\; \hat{\epsilon}_{t-1}\lt\tau \end{cases},\]
and the entire expression refers to 
\[\Delta \hat{\epsilon}_{t}=\rho_1 Q_t \hat{\epsilon}_{t-1} +\rho_2 (1-Q_t) \hat{\epsilon}_{t-1}+\xi_t\]

Another click-and-drop approach (Threshold-based)

The preceding is not the only way to do click-and-drop approach to specify TAR/M-TAR model. Here is an alternative. Use the inbuilt Eviews threshold regression method. This inbuilt alternative offers the flexibility to get the model estimated when the threshold is to be estimated endogenously. It relies on the Bai-Perron approach.

Figure 10

Figure 11

Figures 10 and 11 give the details to specify the model using the inbuilt threshold method in Eviews. In the first editbox, we simply type the dependent variable (that is, d(epsilon)) and the independent variable (that is, epsilon(-1)), while we type the threshold variable (that is, epsilon(-1)) in the
Threshold variable specification editbox. To instruct Eviews that the threshold value should be set to 0, we use the Options tab where we select the User-specified from the dropdown and input 0 in the Values editbox from Threshold specification.

The results from these two alternative ways to estimate the model gives the same results as reported in Figure 12.


Figure 12

But notice that the we've not factored in the fact that the residuals may have serial correlation and ARCH effects. Suppose you already know the optimal lag. We can simply estimate the following, where we have assumed the optimal lag length is 8. The boxed editbox in Figure 13 accounts for this.

Figure 13

The result is presented in Figure 14: 

Figure 14

Code it... 

You'd have noticed that the click-and-drop approach can't meet our need for serious research. The click-and-drop approach is too simple and simplicity is not always a virtue. In particular, we are greatly constrained because we cannot repeatedly carry out (loop) some steps that we might be interested in. For example, we are interested in testing for the optimal lag length to correct for serial correlation, but we simply assumed the lag length to be 8 in Figure 13. This is not acceptable in applied research. 

We might need to invest some time in coding the routine for this method. One advantage doing so is repeatability and reusability. 

In Part II, I'll round off on the steps, discuss how to carry out the relevant hypothesis tests regarding the model discussed here and post the integrated routines (codes) for this method...

Unit root test with partial information on the break date

Introduction Partial information on the location of break date can help improve the power of the test for unit root under break. It is this ...