Blog Archive

Showing posts with label add-in. Show all posts

Friday, December 31, 2021

Unit root test with partial information on the break date

Introduction

Partial information on the location of break date can help improve the power of the test for unit root under break. It is this observation that informs the unit root testing under a local break-in trend by Harvey, Leybourne, and Taylor (2013) where the authors employ partial information on the break date. It builds on the insight first projected by Andrews (1993), who observed that prior information about the location of the break will help even if the analysts do not have full information about the precise break date.

The setback of most of the unit root tests that allow for breaks is that they lose their power if there is no such break compared to the tests that do not account for such break in the first place. Yet another issue with the procedure for detecting break dates is that when the break dates are not large enough there is tendency that they will not be detected. Undetected breaks when they are present can lead to loss of power in this case even for the tests that do not allow for such break. It then means that testing for unit root under breaks must be carefully sorted out.

In short the idea is to employ restricted search and this involves searching within the domain of the break where it is more likely for the break to have occurred. The benefit of this restricted search is that uncertainty around the break point reduces should there be a break point there indeed. The improvement in power as a result therefore means that the test should not fail to reject when it should.


HLT Approach

Harvey, Leybourne and Taylor (2013), in pursing this objective, adopted the Perron-Rodríguez (2003) approach employing the GLS-based infimum test because of its superior power. It is found that the GLS-based infmum tests perform better among those tests that do not allow for break detection and has greater robustness among those that allow for it. To robustify this approach, they proposed the union of rejections strategy. The union of rejections strategy attempts to derive power from the two discreet worlds, in which case the strategy pools the power inherent in the restricted-range with-trend break and the without-trend break unit roots. Using this strategy, the null of unit root is rejected 

if either the restricted-range with-trend break infimum unit root test or the without-trend break unit root test rejects.

In this way, there is no need for prior break date detection, which in itself can compromise the power of the test. 


Model

We can begin our review of this method by stating the following DGP:\[\begin{align*}y_t=&\mu+\beta t+\gamma_T DT_t (\tau_0)+u_t, \;\; t=1,\dots,T\\ u_t=&\rho_T u_{t-1}+\epsilon_t  \;\; t=2,\dots,T\end{align*}\]where \(DT_t(\tau)=1(t>[\tau T])(t-[\tau T])\). The null hypothesis is \(H_0:\rho_T=1\) against the alternative that \(H_c:\rho_T=1-c/T\) where \(c>0\). A crucial assumption which features in the computation of the asymptotic critical value is that the trend break magnitude is local-to-zero so that uncertainty can be captured, that is, \(\gamma_T=\kappa\omega_\epsilon T^{-1/2}\) with \(\kappa\) is a constant. 

The Procedure to Computing the Union of Rejections

To construct the union of rejections decision rule, the steps are involved have been broken down to a couple of blocks.
  • STEP 1: The following sub-steps are involved: 
      1. Assume there is a known break date at \(\tau T\), where \(\tau\in(0,1)\). The data are first transformed as:\[Z_{\bar{\rho}}=[y_1,y_2-\rho y_1,\dots,y_T-\rho y_{T-1}]^\prime\] and \[Z_{\bar{\rho},\tau}=[z_1,z_2-\rho z_1,\dots,z_T-\rho z_{T-1}]^\prime\]where \(z_t=[1,t,DT_t(\tau)]^\prime\) and \(\bar{\rho}=1-\bar{c}/T\) with \(\bar{c}=17.6\);
      2. Apply the LS regression on the transformed data in Step 1 and obtain the residuals \(\tilde{u}_t=y_t-\tilde{\mu}-\tilde{\beta} t-\tilde{\gamma} DT_t (\tau)\). The GLS estimates for \(\theta\), \(\tilde{\theta}=(\tilde{\mu},\tilde{\beta},\tilde{\gamma})\), are\[\tilde{\theta}=\underset{\theta}{\text{argmin}}\; u_t^\prime u_t;\]
      3. The ADF is applied to the residuals obtained in Step 2:\[\Delta \tilde{u}_t=\hat{\pi} \tilde{u}_{t-1}+\sum_{j=1}^k\hat{\psi}_j\Delta\tilde{u}_{t-j}+\hat{e}_t.\]
  • STEP 2: Instead of assuming a known break date, HLT make use of the infimum GLS detrended Dickey-Fuller statistic as follows:
      1. Define the window mid-point parameter \(\tau_m\) and the window width parameter \(\delta\);
      2. Define the search window as\[\Lambda(\tau_m,\delta):=[\tau_m-\delta/2,\tau_m+\delta/2]\]and, if \(\tau_m-\delta/2<0\) or \(\tau_m+\delta/2>1\), then define the following respectively \(\Lambda(\tau_m,\delta):=[\epsilon,\tau_m+\delta/2]\) or \(\Lambda(\tau_m,\delta):=[\tau_m-\delta/2,1-\epsilon]\), where \(\epsilon\) is a small number set to 0.001.
      3. Then compute \[MDF(\tau_m,\delta):=\underset{\tau\in\Lambda(\tau_m,\delta)}{\text{inf}}DF^{GLS}(\tau)\]which amounts to repeating the sub-steps Step 1 for every observation corresponding to the fraction defined in the restricted window \(\Lambda(\tau_m,\delta)\) and finding the least DF statistic 
  • STEP 3: The Elliot et al (1996) DF-GLS is carried out as follows:
      1. The data are first transformed as in Step 1 in the procedure above without including the break date and with \(\bar{c}=13.5\);
      2. Apply the LS regression on the transformed data in Step 1 and obtain the residuals \(\tilde{u}_t^e=y_t-\tilde{\mu}-\tilde{\beta} t\). The GLS estimates for \(\theta\), \(\tilde{\theta}=(\tilde{\mu},\tilde{\beta})\), are\[\tilde{\theta}=\underset{\theta}{\text{argmin}}\; u_t^{e\prime} u_t^e;\]
      3. The ADF is applied to the residuals obtained in Step 2:\[\Delta \tilde{u}^e_t=\hat{\pi} \tilde{u}_{t-1}^e+\sum_{j=1}^k\hat{\psi}_j\Delta\tilde{u}_{t-j}^e+\hat{e}_t.\]
      4. The DF-GLS statistic is the t-value associated with \(\hat{\pi}\) and is denoted \(DF^{GLS}\)
  • STEP 4: The union of rejections strategy involves the rejection of the null of unit root, as stated early, 

if either the restricted-range with-trend break infimum unit root test or the without-trend break unit root test rejects.

The decision rule is therefore given by\[U(\tau_m,\delta):=\text{Reject} \;H_0 \;\text{if}\;\left\{DF^{GLS}_U(\tau_m,\delta):=\text{min}[DF^{GLS},\frac{cv_{DF}}{cv_{MDF}}MDF(\tau_m,\delta)]<\lambda cv_{DF}\right\}\]where \(cv_{DF}\) and \(cv_{MDF}\) are the associated critical values and \(\lambda\) is a scaling factor. The critical values \(cv_{DF}\) are reported in Elliot et al (1993) and those of \(cv_{MDF}\) are reported in HLT (2013). The critical values for the scaling factor are also reported in Table 2 of HLT (2013).


Eviews addin

For the purpose of implementing this test seamlessly, I have developed an addin in Eviews. As usual, the philosophy of simplicity has been emphasized. Like the inbuilt unit root tests, the addin has been latched on the series object. This means it is a menu in the time series object's add-ins. To have it listed as seen in Figure 1, you must install the addin. 

In Figure 1, I subject LINV series to HLT unit root. 

Figure 1


The following dialog box presents you with options to choose from. The lag selection criteria include the popular ones such as the Akaike, Schwarz and Hanna-Quinn as well as their modified versions. Additionally, there is the t-statistic for optimal lag length selection. Significance levels indicates the choices for the level of significance for the lag length. The window width and the widow mid-point are also presented and you can also choose them as appropriate. The trimming can become too extreme sometimes. Under this circumstance, you are likely to express errors, whereby the addin will issue error message to inform you appropriately. This is likely going to be the case if the number of observations is too small.

The prior break date edit box can be left empty if there is no such date to be considered. Yet, The window width  and mid-point can be adjusted. A diffuse prior can be expressed with large value of window width. Lower values of window width suggests that the analyst expresses more certainty about the mid-point. For example, if the window width \(\delta=0.050\) is combined with \(\tau_m=0.50\) it means the analyst expresses more conviction that the break date happens around the mid point of the data than when he combines the width \(\delta=0.200\) with the same mid-point.

Figure 2

The output is presented in Figure 3. According to Equation 4 in HLT, one has to compare DF-GLS-U with the corresponding \(\lambda\)-scaled critical value denoted as Lam-sc'd c.v. In case the DF-GLS-U values are less than the Lam-sc'd c.v., then the null hypothesis of unit root is rejected. In this example, the DF-GLS-U are higher than those for Lam-sc'd c.v. Thus, the null hypothesis near unit root is not rejected.

Figure 3

Lastly, if there are reasons to choose a break date around which there is a doubt, this can be entered as a prior date break. In Figure 4, I enter 1976Q1 as the break date and then express the extent of my doubt around this date by selecting the window width as 0.05. 

Figure 4

Compared to window width of 0.200, this is a lot more precisely expressed. Thus, it is no surprise that the break date is found in the neighborhood of the putative break date. This can be seen in Figure 5. 

Figure 5

Happy New Year everyone. Let moderation be your guiding principle as you go out to celebrate the new year. 💥💥💥

Wednesday, November 24, 2021

Quantile-on-Quantile Regression Using Eviews

Introduction

Nonlinearity is everywhere. To model it, analysts have conjectured in their wildest imagination all manners of techniques. Quantile-on-quantile is one of the latest in the research community. If you haven't seen it applied like most other techniques, it's because it requires a lot of heavy lifting in terms of coding. I have brought you this to ease the burden of using one of the most widely used platforms -- Eviews.

Conventionally, quantile regression traces out the effects of the conditional distribution of dependent variable on the dependent variable itself through the impact of the independent variable. It is like asking what the impact of interest rate will be like on inflation if inflation has already reached a particular threshold. Of course, such a question cannot be addressed straightforwardly within the received OLS knowledge. This is where quantile regression stands in to fill the gap.

But then, what about the new estimation strategy quantile-on-quantile regression? Here, both the conditional distributions of the dependent and independent variables modulate the impact of the latter on the former. So, in this case, the question we are interested in is, for example, how extreme inflation (e.g., inflation at say 95 percentile) will respond to extreme interest rate (e.g., at 30-40 percent higher than usual). Put simply, we are interested in how different levels of the independent variable will alter the distribution of the dependent variable. This question cannot be addressed using quantile regression. Because of the existence of two extreme scenarios surfacing within the same policy strategy, the quantile-on-quantile regression comes to the rescue.

QQR is proposed by Sim and Zhou (2015). Yes, it is such a recent method. Again, we are not interested so much in the theory behind this. This can be found in their paper, and I hope the summary here will help you understand that aspect of their paper.
 

Summary of the method

Let the relationship between \(x_t\) and \(y_t\) be given by
\[y_t=\beta^\theta (x_t)+\epsilon_t^\theta\]
Now let \(\tau\)-quantile of \(x_t\) be \(x_t^\tau\). Sim and Zhou suggest the relationship above be approximated by first order Taylor expansion of \(\beta^\theta (x_t)\) around \(x_t^\tau\)
\[\beta^\theta (x_t)\approx \beta_1 (\tau,\theta) + \beta_2 (\tau,\theta)(x_t-x_t^\tau).\]
If follows that
\[y_t= \beta_1 (\tau,\theta) + \beta_2 (\tau,\theta)(x_t-x_t^\tau)+\epsilon_t^\theta\]
At a given value of \(\tau\), the preceding equation can be estimated by quantile regression. Basically, we estimate\[\hat{\beta} (\tau,\theta)=\underset{\beta (\tau,\theta)}{\text{argmin}}\sum_{t=1}^T\rho_\theta \left(y_t - \beta_1 (\tau,\theta)-\beta_2 (\tau,\theta)(x_t-x_t^\tau)\right)\]
where \(\rho_\theta(\cdot)\) is the check function. Rather than estimating this model, the authors realize that there is a need to weight the function appropriately. The reason is that the interest is in the effect exerted locally by the \(\tau\)-quantile of \(x_t\) on \(y_t\). This makes sense in that otherwise the effect will not be contained in the neighbourhood of \(\tau\). They choose the normal kernel function to smooth out unwanted effects that could contaminate the results. The weights so generated are inversely related to the distance between \(x_t\) and \(x_t^\tau\) or, equivalently, between the empirical distribution of \(x_t\), \(F(x_t)\), and \(\tau\). I follow suit in developing the code. Now, the model becomes
\[\hat{\beta} (\tau,\theta)=\underset{\beta (\tau,\theta)}{\text{argmin}}\sum_{t=1}^T\rho_\theta \left(y_t - \beta_1 (\tau,\theta) - \beta_2 (\tau,\theta)(x_t-x_t^\tau)\right)K\left(\frac{(x_t-x_t^\tau)}{h}\right)\]
where \(h\) is the bandwidth. As the choice of bandwidth is critical to getting a good result, in this application, I choose the Silverman optimal bandwidth given by
\[h=\alpha\sigma N^{-1/3}\]
where \(\sigma=\text{min}(IQR/1.34, \text{std}(x))\), \(IQR\) is the inter-quantile range, \(N\) is the sample size and \(\alpha=3.49\).

One snag, however, needs to be pointed out. Eviews does not feature surface plot normally used to present the results in this case. To me, this turns to be an advantage because a more revealing graphical technique has been devised for that purpose. It aligns the boxplots to summarize the results in an equally excellent, if not better, way.

In what follows, I will lead you gently into the world of QQR addin in Eviews

Eviews example

Addin Environment

The QQR addin environment is depicted in Figure 1. If you've already installed the addin, you can click on the Add-ins tab to display the QQR dialogue box as seen below.

Figure 1

The dialogue box is self-explanatory. Three edit boxes are featured. The first one asks you to input the dependent variable followed by a list of exogenous variables. You can include both C and @trend among the exogeneous variables here. However, you should not include the quantile exogeneous variable, which you are required to enter in the second edit box. Note that only one quantile exogeneous variable can be entered here. In the third edit box the period of estimation is indicated.

Example is given in Figure 2. Here, we are estimating the quantile-on-quantile effects of oil price (OILPR) on exchange rate (EXR). We include the third variable, interest rate (INTR). This estimation is carried out over the period of May 2004 and January 2020. Although oil price is an exogenous variable, by entering it in the second variable, we make it the variable whose quantile effect we want to study. 


Figure 2

A couple of options are provided. The Coefficient plots category wants you to choose whether to produce the graphs for all the variables in the model or to just produce the graph for the quantile exogenous variable alone. The default is to generate the graphs for all the coefficients in the model. The Graph category wants you to choose to rotate or not the plots. Orientation may count at times. The default is to rotate the plots. Lastly, there is the Plot Label category. How do you want your graphs labelled? On one side or on both sides. It may not matter much. But beauty they say is in the eyes of beholder. I think I love the double-sided label. Hence the default. These categories are boxed with color code in Figure 3.

Figure 3

Graphical Outputs

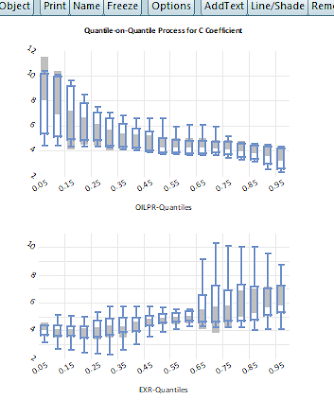
As noted above, Eviews has yet to develop either the contour or the surface plot usually favored for the quantile-on-quantile result presentations. In the absence of these valuable tools, I opt for boxplot. Boxplot presents the distribution of the data with a couple of details (median, mean, whiskers, outliers and in Eviews confidence interval). But it is a 2-D plot. This means one can only view one side of the object on the x-y plane. To view the other side of the object, one needs to rotate the object. In other words, one needs two 2-D plots to capture some details of the 3-D objects. That is why we have the two plots for one parameter! The graph is named quantileonquantileplot##. The shade indicates 95% confidence interval. 

In Figures 4-6, I present the graphs for the three coefficients. 


Figure 4
 

Figure 5


Figure 6

The same results are presented in Figures 7-9 but this time not rotated!


Figure 7


Figure 8

Figure 9

External resources

If one really wants to report the contour or surface plot, there is still hope. Eviews has provided an opportunity to interact with external computational software like MATLAB and R. Since I have MATLAB installed on my system, I simply run the following code in Figure 10. The inputs to the snippet include the matrix and vector objects generated and quietly dumped by the QQR addin in the workfile. They are a19\(\times\)k  coefmatrix and a 19-vector taus respectively, where k is the number of parameters estimated.  


Figure 10

Figures 11-13 compare the graphs of the estimated coefficients from the QQR addin with those generated using MATLAB. Therefore, you can still estimate your quantile-on-quantile using the Eviews addin as discussed here and have the surface plots for the estimated coefficients done in MATLAB or R. What is more? R is a open source and free.


Figure 11


Figure 12


Figure 13

Requirement

This addin runs fine on Eviews 12. It hasn't been done yet on lower versions. 

How to get the addin...
Wondering how to have this addin, are you? Follow this blog!😏 The link is here to download the addin.

Thank you for tagging along.


Unit root test with partial information on the break date

Introduction Partial information on the location of break date can help improve the power of the test for unit root under break. It is this ...